2 Lakes in British Columbia
Xingming Li and Panagiotis Tsigaris
About Lakes in British Columbia
British Columbia’s lakes are mirrors that magnify the immense beauty and intricacy of this region. These water bodies are woven into the very tapestry of the land, ranging from calm coastal recesses to harsh mountainous hollows. Additionally, these lakes have more value than just their breathtaking views. They act as environmental sustainability, cultural diversity and economic resilience in a nutshell. For Indigenous peoples, they remain sacred areas that interweave spiritual with cultural and practical dimensions of existence. In this chapter, we intend to delve into what holds British Columbia’s lakes so tightly together with their integral worth. By looking through an indigenous lens which is often underrepresented in environmental discourse, we hope to unmask the real story behind these lakes; not simply as parts of an ecosystem but as fundamental tenets that give life meaning.
The value of British Columbia’s lake ecosystems can be estimated using the size of the surface area of lakes and the value of various ecosystem services per ha per year. The surface area of 7,121 named lakes is 1,740,861 ha, with the smallest lake being Bray Lake (close to the community of Chase) at 0.08 ha and the largest lake being Williston Lake at 172,669 ha (GeoBC, n.d.). The average surface lake is 244 ha, and the median is 25 ha, indicating a skewed distribution of significantly smaller lakes. There are 378,855 unnamed lakes with a total surface area of 506,969 ha. The unnamed lakes, as expected, are very small, with the average size being 1.34 ha. The total surface area of all 385,976 lakes is 2,247,830 ha.
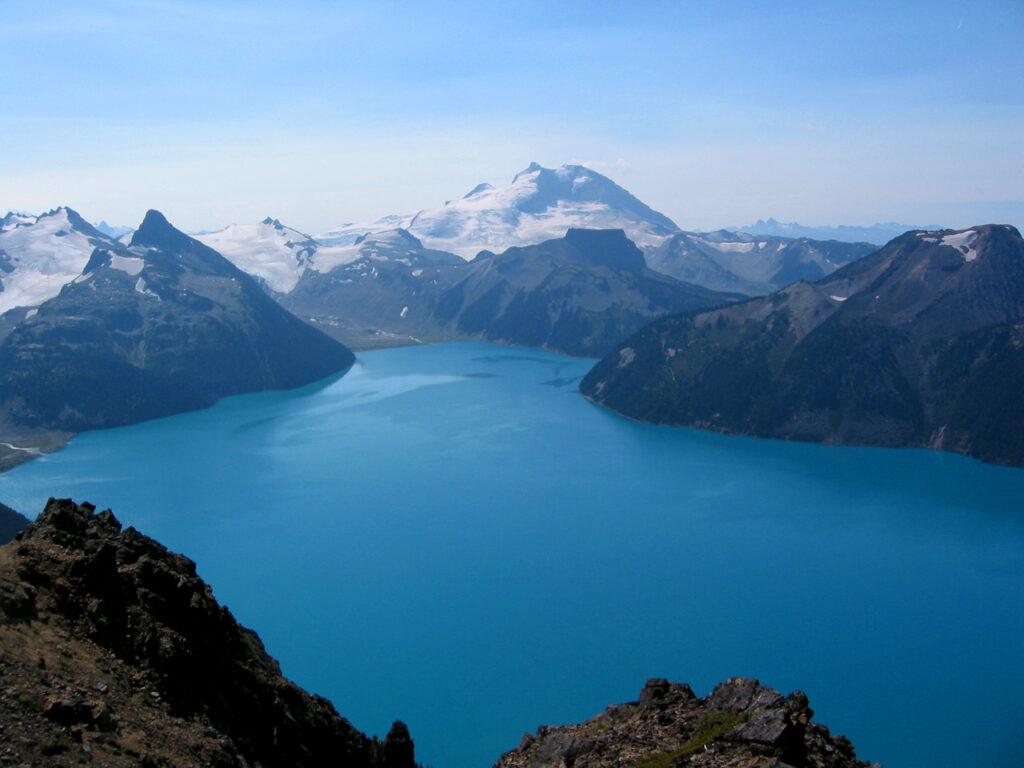
Table 1 shows the regional distribution of named and all lakes regarding their surface area and the number of lakes. Bulkley-Nechako northeast region has the largest surface area of named lakes (GeoBC, n.d.). Thompson-Nicola’s total surface area of all 861 named lakes in the region is 79,355 ha. Cariboo has the most named lakes at 1,015 relatives to any other region. Including small unnamed lakes, Bulkley-Nechako still maintains the largest surface area, but in terms of the number of lakes, Northern Rockies has 43,310, which surpasses Cariboo’s 42,986 lakes. Thompson-Nicola has 21,697 lakes occupying 102,329 ha of space. Table 1 provides a larger breakdown.
Table 1: Lakes in British Columbia by Region
| Skip Table 1A |
||
| Region | # of Lakes | Area (ha) |
|---|---|---|
| Alberni-Clayoquot | 137 | 27,880 |
| Bulkley-Nechako | 695 | 427,524 |
| Capital | 86 | 1,925 |
| Cariboo | 1,015 | 177,480 |
| Central Coast | 127 | 31,367 |
| Central Kootenay | 226 | 114,175 |
| Central Okanagan | 101 | 38,343 |
| Columbia-Shuswap | 155 | 81,898 |
| Comox Valley | 129 | 3,417 |
| Cowichan Valley | 57 | 8,062 |
| East Kootenay | 248 | 16,295 |
| Fraser Valley | 163 | 35,763 |
| Fraser-Fort George | 436 | 92,014 |
| Greater Vancouver | 103 | 10,010 |
| Kitimat-Stikine | 335 | 67,000 |
| Kootenay Boundary | 79 | 3,576 |
| Mount Waddington | 158 | 23,785 |
| Nanaimo | 70 | 2,949 |
| North Okanagan | 127 | 12,524 |
| Northern Rockies | 105 | 32,086 |
| Okanagan-Similkameen | 188 | 5,962 |
| Peace River | 328 | 173,814 |
| Powell River | 87 | 20,786 |
| Skeena-Queen Charlotte | 187 | 25,315 |
| Squamish-Lillooet | 193 | 21,929 |
| Stikine | 407 | 175,617 |
| Strathcona | 255 | 25,185 |
| Sunshine Coast | 63 | 3,821 |
| Thompson-Nicola | 861 | 79,355 |
| Total for All Regions | 137 | 1,740,861 |
| Skip Table 1B |
||
| Region | # of Lakes | Area (ha) |
|---|---|---|
| Alberni-Clayoquot | 2,618 | 30,788 |
| Bulkley-Nechako | 28,144 | 480,844 |
| Capital | 887 | 2,220 |
| Cariboo | 42,986 | 238,579 |
| Central Coast | 15,288 | 57,119 |
| Central Kootenay | 3,378 | 117,092 |
| Central Okanagan | 631 | 38,656 |
| Columbia-Shuswap | 5,714 | 89,761 |
| Comox Valley | 1,278 | 3,825 |
| Cowichan Valley | 624 | 8,372 |
| East Kootenay | 3,904 | 21,815 |
| Fraser Valley | 2,987 | 39,295 |
| Fraser-Fort George | 16,417 | 118,025 |
| Greater Vancouver | 989 | 10,577 |
| Kitimat-Stikine | 50,545 | 127,753 |
| Kootenay Boundary | 1,251 | 4,111 |
| Mount Waddington | 7,425 | 35,853 |
| Nanaimo | 950 | 3,282 |
| North Okanagan | 1,239 | 14,443 |
| Northern Rockies | 43,310 | 82,536 |
| Okanagan-Similkameen | 1,705 | 6,788 |
| Peace River | 35,452 | 205,443 |
| Powell River | 1,069 | 23,597 |
| Skeena-Queen Charlotte | 18,215 | 50,535 |
| Squamish-Lillooet | 4,354 | 26,098 |
| Stikine | 66,074 | 268,431 |
| Strathcona | 5,554 | 33,288 |
| Sunshine Coast | 1,291 | 6,373 |
| Thompson-Nicola | 21,697 | 102,329 |
| Total for All Regions | 385,976 | 2,247,830 |
Note. Adapted from Freshwater Atlas by GeoBC (n.d.).
Value of Ecosystem Services
This research attempts to place a conservative value of ecosystem services per hectare per year using the benefit transfer method (BTM) and provide a first approximation of valuation. The value of ecosystem services per hectare per year for lakes is extracted from studies in Canada, the US, and the UK from the Ecosystem Services Valuation Database (ESVD) (Brander et al., 2023). Table I in this book’s Introduction summarizes the value of lakes’ ecosystem services.
The total ecosystem value per hectare per year is estimated at an average of $78,804, while the median is $57,726. After removing some low-count ecosystem services, a conservative reference to the total median value would be $23,542/ha/year. The total valuation is an underestimate for two reasons. First, the studies from the ESVD have not assessed many ecosystem services, especially in the regulation service. Second, the price reflects the marginal consumer for the benefits lakes provide and thus does not capture all consumer surplus but only the producers’ surplus from the natural asset.
However, consumers can freely enjoy all the producers’ surpluses since these services are not market-traded goods or services. Even so, these values are much smaller than the $108,361/ha/year value Brander et al. (2023) estimated for lakes and rivers. The highest value is observed in the category “opportunities for recreation and tourism,” followed by the category water provision. However, only one regulatory service is priced that of moderation of extreme events, which will become more important with intensifying climate change. When 132 values across 16 ecosystem services from various North American, Europe, and Oceania are added, the valuation is higher since these values are additive. Including all countries in the three continents, the estimated value per hectare is an average of $158,876/ha/year, a median of $107,449/ha/year, and a modified median, which removes the low-count ecosystem services values, of $41,250/ha/year.
Valuation of Lakes in BC
To get to a very conservative assessment of the value of ecosystem services of lakes in British Columbia, we will use the modified median from the Canada, US, and UK studies. The total surface area of all lakes in BC is 2.248 million hectares. Hence, the value of ecosystem services of all BC lakes would produce a minimum of $53 billion, a median of $129.8 billion, and a maximum of $177.2 billion per year for British Columbians. By only including the 7,121 named lakes, the estimated valuation becomes $41 billion, $100.5 billion, and $137.2 billion per year of benefits. In comparison, British Columbia’s GDP was USD 284.8 billion in 2022 (Statistics Canada, 2023).
Hence, even at the most conservative estimation, named lakes provide benefits equal to 14.4% of British Columbia’s GDP. The BC population reached 5.3 million in 2022 (“British Columbia,” 2023). The per capita benefits of the ecosystem services of named lakes are approximately $7,736 at the minimum. Using Costanza et al.’s (2014) value of lakes and rivers at USD 15,517/ha/year, the benefits of the 7,121 named lakes is USD 27 billion per year, or USD 5,096 for each British Columbia. British Columbians and visitors collectively enjoy these huge ecosystem benefits.
“We are almost all bodies of water, we use water to ground ourselves, we use water spiritually, to get food from the water, to drink we sleep better by the water. We live in a beautiful closed system, if we pollute the water, we desecrate our precious water and ourselves. We not only harm ourselves, but we harm others and our children, and their children.”
— Indigenous Elder Joanne Brown, Member of the Cheslatta Carrier Nation, L’silu clan, A longtime employee of Thompson Rivers University and now one of TRU’s Indigenous Elders.
Natural Asset Value
Thus, the value of all lakes as a natural asset is USD 3.5 trillion at a minimum. For named lakes specifically, they have a value of USD 2.7 trillion with a 1.5% discount rate to account for a growing value to the ecosystem services per year. BC Assessment reviews 2,160,828 properties across the province, and as of July 1, 2022, the value of these properties is CAD 2.72 trillion (Ali, 2023). Hence, the value of our lakes exceeds the value of all properties across the province. Using a 0.1% discount rate, the value of lakes in BC increases to USD 53 trillion.
Table 2 provides a summary of the value of ecosystem services and natural assets.
Table 2: Value of Ecosystem Services of Lakes in British Columbia (in billions of USD)
| Skip Table 2A |
|||
| Valuation Type | Average | Median | Modified Median |
|---|---|---|---|
| Ecosystem Services | 53 | 130 | 177 |
| Natural Asset | 3,533 | 8,667 | 11,800 |
| Skip Table 2B |
|||
| Valuation Type | Average | Median | Modified Median |
|---|---|---|---|
| Ecosystem Services | 41 | 100 | 137 |
| Natural Asset | 2,733 | 6,700 | 9,133 |
| Skip Table 2C |
|||
| Valuation Type | Average | Median | Modified Median |
|---|---|---|---|
| Ecosystem Services | 1.9 | 4.6 | 6.2 |
| Natural Asset | 127 | 307 | 413 |
Conclusion
As we conclude this exploration of British Columbia’s lakes, we come to understand that these waters are far more than ecological assets; they are treasures that have life, history, and the promise of the future. These lakes do more than support biodiversity and regulate climate — they are sanctuaries that nurture the human spirit and fortify the bonds within communities, particularly among Indigenous peoples. The words of Indigenous Elder Joanne Brown remind us that our relationship with these lakes is deeply personal and inherently communal, influencing who we are and how we live. Protecting these lakes goes beyond environmental stewardship — it is a moral duty, ensuring that the rich cultural narratives and the pristine natural beauty they hold are preserved for future generations. Emphasizing Indigenous values and wisdom in our approach to managing these resources is essential. It is through this respectful partnership with nature and acknowledgment of traditional knowledge that sustainable and meaningful preservation can be achieved. This is not just about conservation; it is about honoring and sustaining a legacy of interconnectedness with our natural world.
Media Attributions
Figure 1: “GaribaldiLake-PanoramaRidge” by Seattle Skier (2004), via Wikimedia Commons, is used under a CC BY-SA license.
References
Ali, A. (2023, January 3). Lower Mainland accounts for over 70% of $2.42 trillion BC real estate market. Daily Hive. https://dailyhive.com/vancouver/bc-trillion-real-estate-lower-mainland
Brander, L. M., de Groot, R., Guisado Goñi, V., van ‘t Hoff, V., Schägner, P., Solomonides, S., McVittie, A., Eppink, F., Sposato, M., Do, L., Ghermandi, A., and Sinclair, M., Thomas, R., (2023). Ecosystem services valuation database (ESVD). Foundation for Sustainable Development and Brander Environmental Economics. https://www.esvd.net/
British Columbia. (2023, April 7). In Wikipedia. https://en.wikipedia.org/w/index.php?title=British_Columbia&oldid=1148638639
Costanza, R., de Groot, R., Sutton, P., van der Ploeg, S., Anderson, S. J., Kubiszewski, I., Farber, S., & Turner, R., K. (2014). Changes in the global value of ecosystem services. Global Environmental Change, 26, 152–158. https://doi.org/10.1016/j.gloenvcha.2014.04.002
GeoBC. (n.d.). Freshwater atlas. Government of British Columbia. https://www2.gov.bc.ca/gov/content/data/geographic-data-services/topographic-data/freshwater?keyword=fresh&keyword=lake&keyword=and&keyword=river&keyword=atlas
Seattle Skier. (2004). GaribaldiLake-PanoramaRidge [Image]. Wikimedia Commons. https://commons.wikimedia.org/wiki/File:GaribaldiLake-PanoramaRidge.jpg
Statistics Canada. (2023). Gross domestic product, income-based, provincial and territorial, annual (x 1,000,000). https://doi.org/10.25318/3610022101-eng
